
ECG / EKG – E12
An Electrocardiograph is a medical device used to measure and record the electrical activity of the heart. It provides a visual representation of the heart’s rhythm and electrical conduction through a series of waves on a graph.
These waves are typically labeled as P, Q, R, S, and T waves, corresponding to different phases of the heart’s electrical cycle.
The ECG / EKG E12 is an essential tool in diagnosing various heart conditions, including arrhythmias, heart attacks, and other cardiac abnormalities.
By analyzing the pattern and timing of these waves, doctors can assess the heart’s function and identify potential issues.
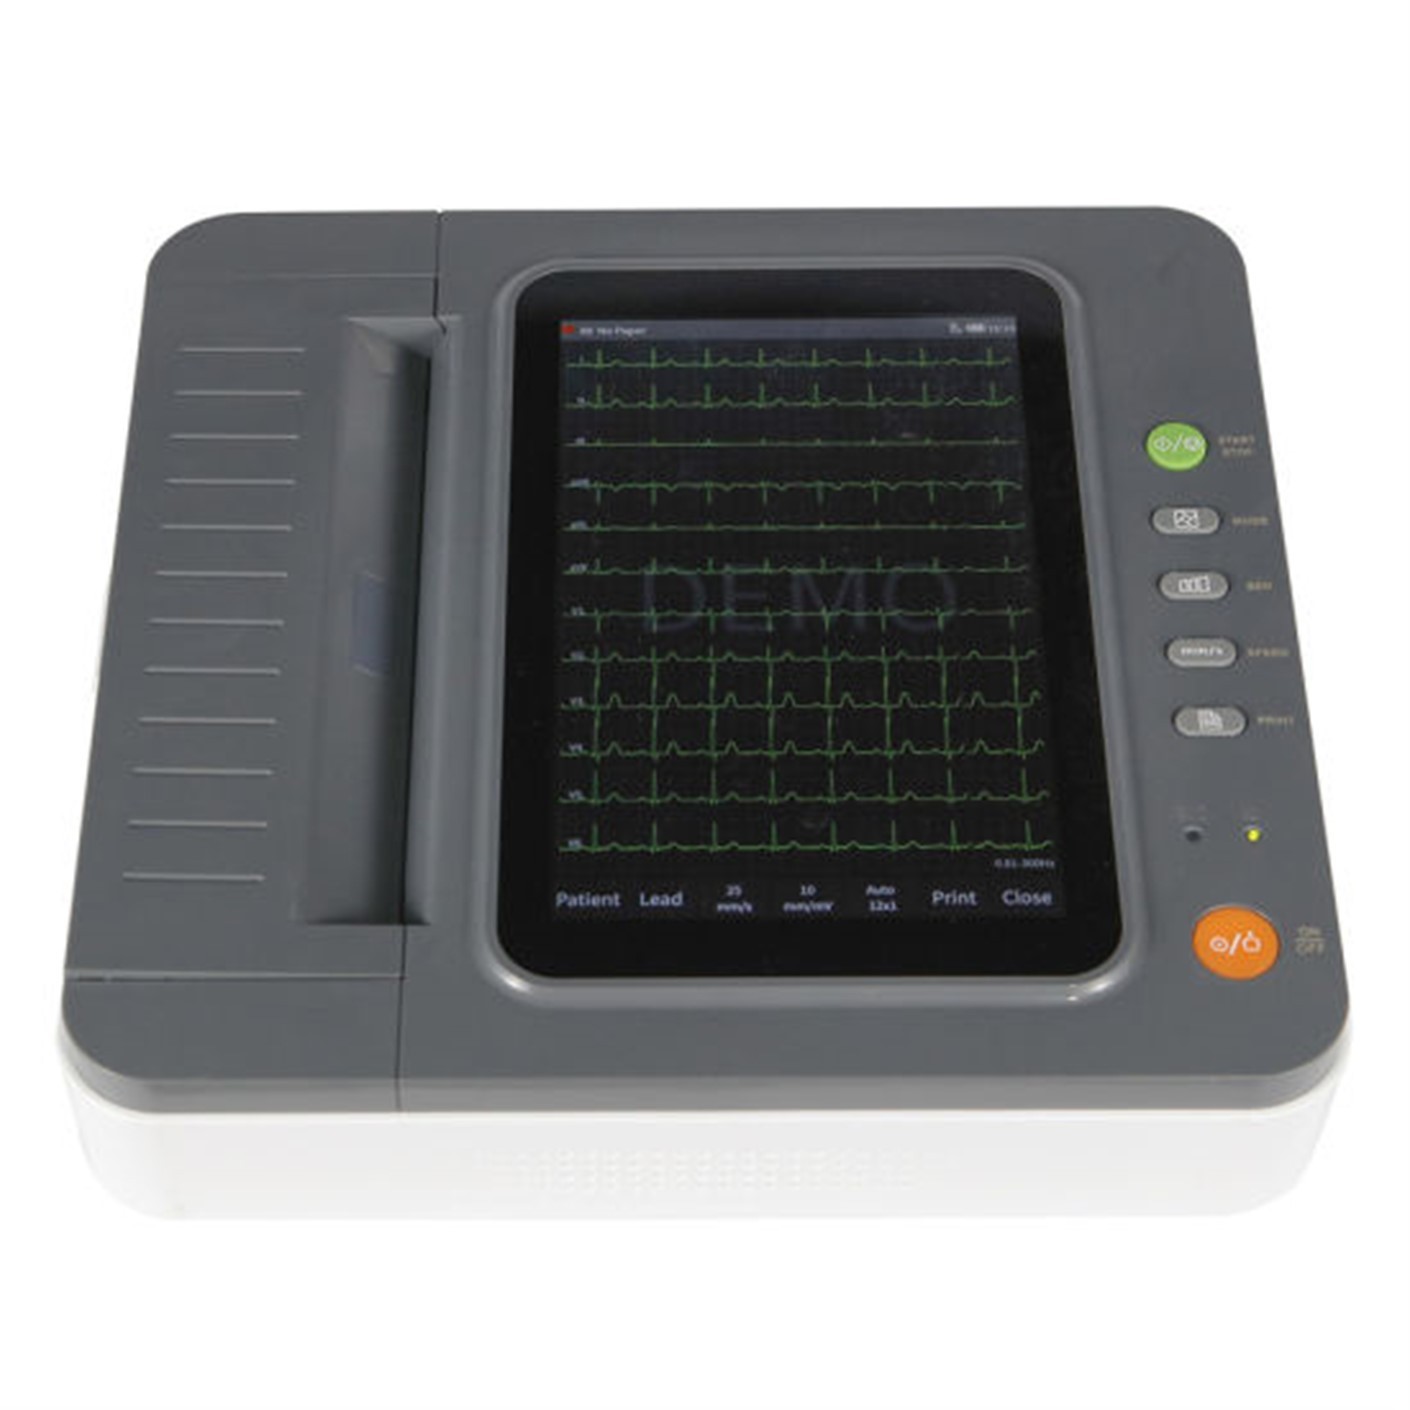
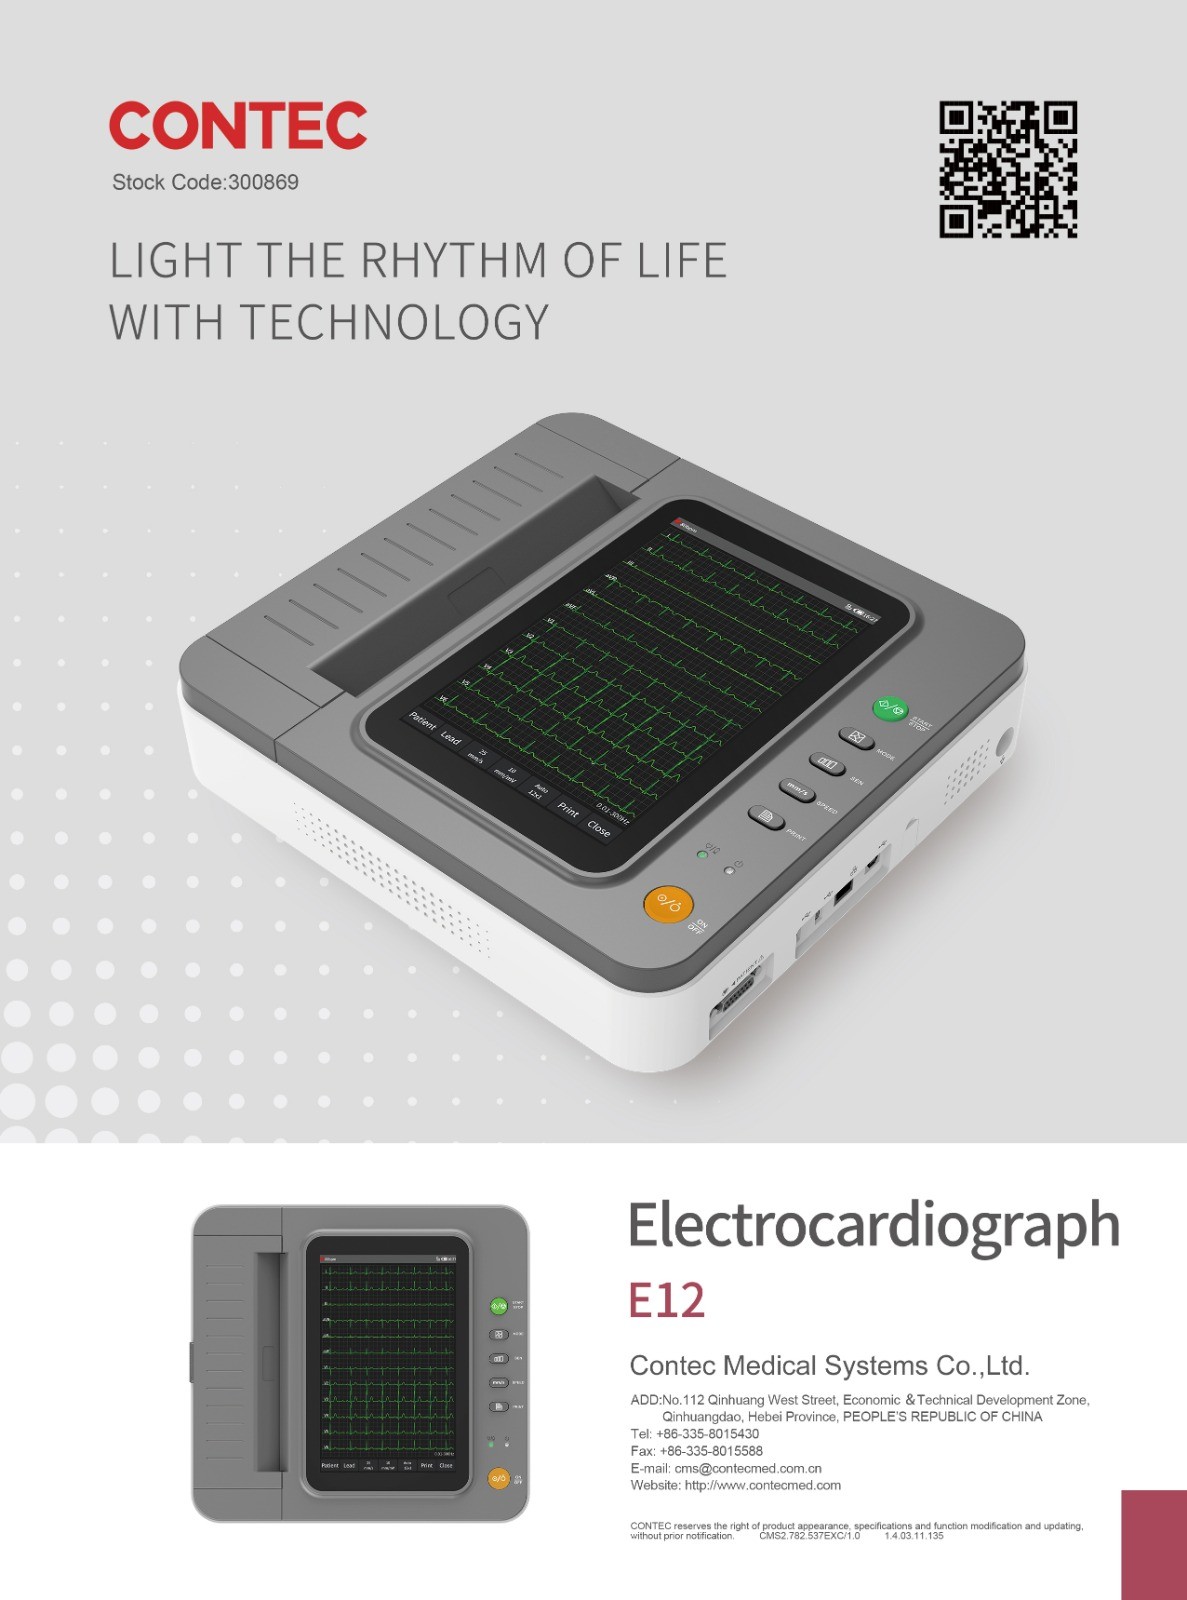
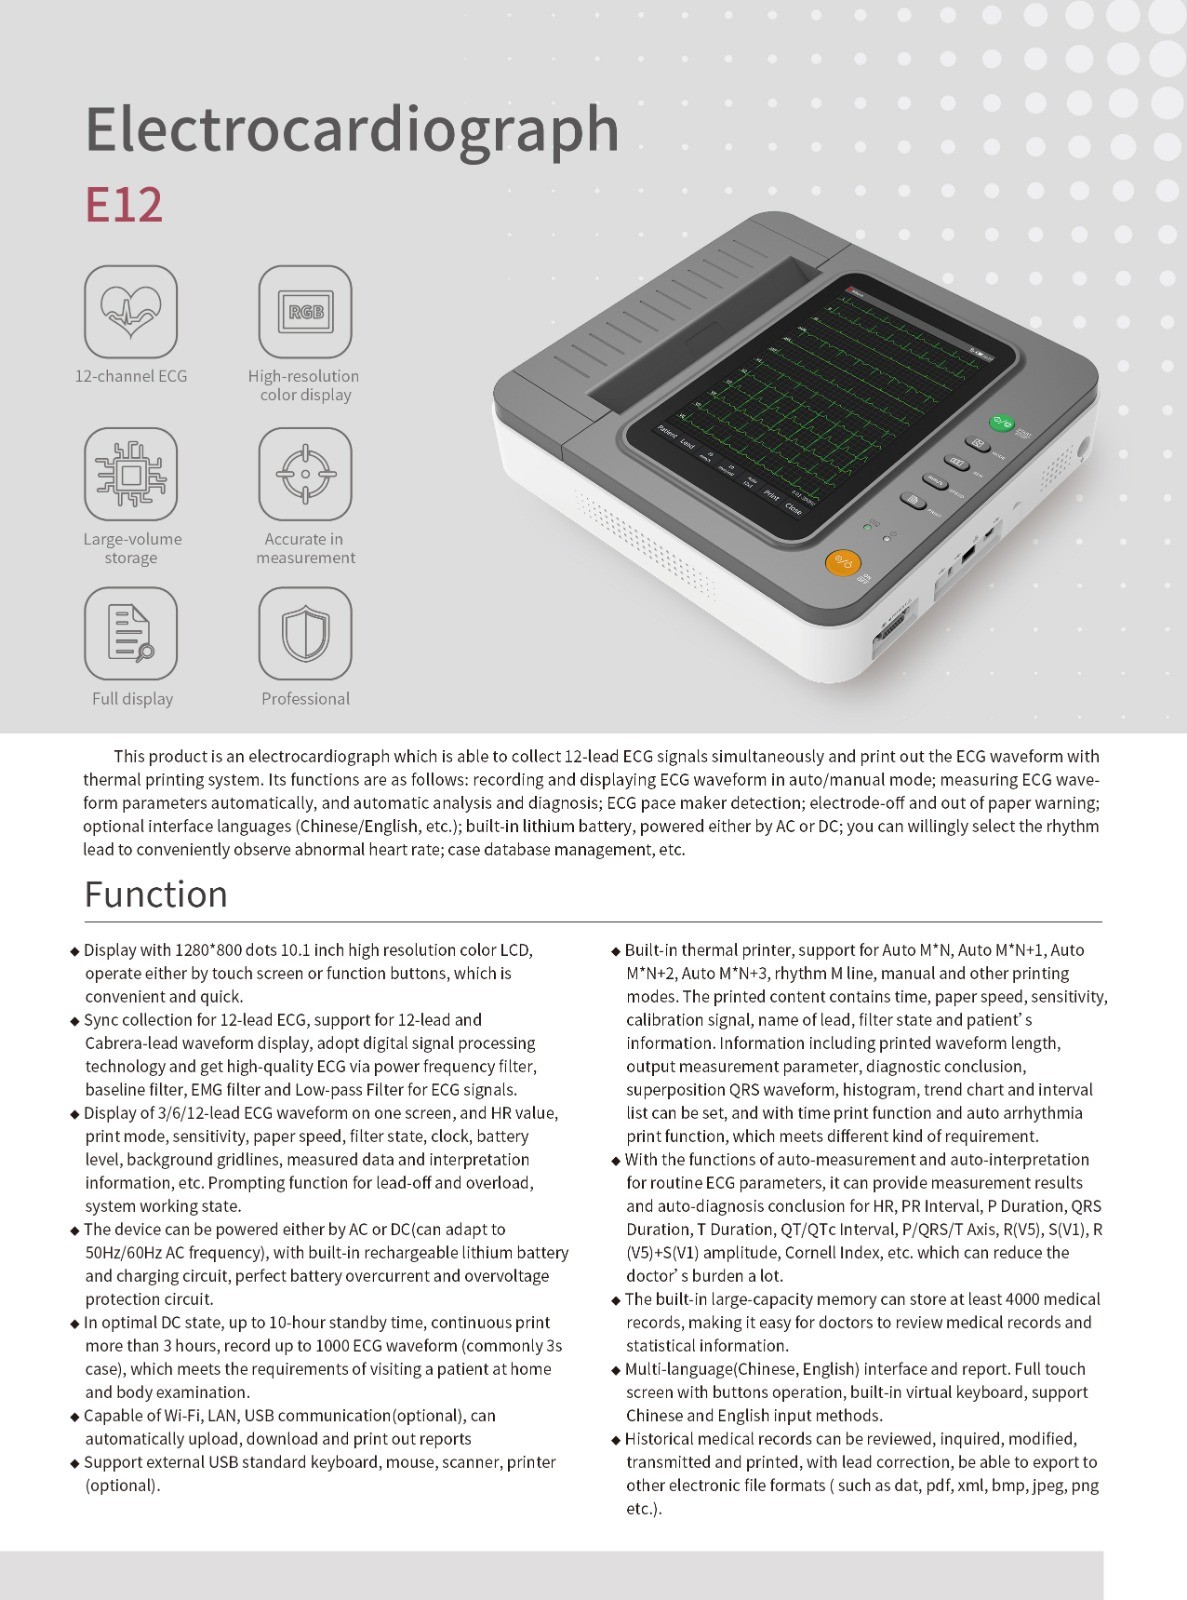
An electrocardiograph that is able to collect 12-lead ECG signals simultaneously and print out the ECG wave form with thermal printing system
An electrocardiograph (ECG) works by detecting and recording the electrical activity of the heart. Here’s a step-by-step overview of how it operates:
1. Electrical Activity of the Heart
The heart’s electrical activity starts in the sinoatrial (SA) node, which acts as the natural pacemaker. This electrical impulse travels through the atria, causing them to contract and push blood into the ventricles. The impulse then moves to the atrioventricular (AV) node, down the bundle of His, and through the Purkinje fibers, leading to ventricular contraction.
2. Electrode Placement
To measure this electrical activity, electrodes are placed on specific points on the body. For a standard 12-lead ECG:
- Limb Leads: Electrodes are placed on the arms and legs.
- Chest Leads: Electrodes are placed on the chest, around the heart.
3. Signal Detection
The electrodes detect the electrical impulses generated by the heart. Each electrode picks up electrical activity from a different angle or “view” of the heart, allowing for a comprehensive assessment of its electrical function.
4. Signal Transmission
The electrical signals detected by the electrodes are transmitted to the ECG machine. The machine converts these electrical signals into a graphical representation.
5. Signal Processing
Inside the ECG machine, the electrical signals are amplified and processed. The processed signals are then plotted on graph paper or displayed on a screen as a series of waves and intervals. These include:
- P Wave: Represents atrial depolarization (contraction).
- QRS Complex: Represents ventricular depolarization (contraction).
- T Wave: Represents ventricular repolarization (recovery).
6. Interpretation
The resulting ECG waveform is analyzed for various characteristics, such as:
- Wave Patterns: The shape, size, and timing of each wave.
- Intervals: The time between different waves and complexes.
- Rhythm and Rate: The regularity and speed of the heartbeats.
7. Diagnosis
Doctors interpret these patterns to diagnose heart conditions such as arrhythmias, ischemia, myocardial infarction (heart attack), and other cardiac abnormalities. They look for deviations from the normal pattern, which can indicate specific issues.
An ECG is a non-invasive, quick, and crucial diagnostic tool in cardiology, providing immediate insights into the heart’s health.